
Debug a Dataverse plugin in Visual Studio without the Plugin Profiler
Debug a Dataverse plugin in Visual Studio without the Plugin Profiler
Section titled “Debug a Dataverse plugin in Visual Studio without the Plugin Profiler”Sometimes the trace tells you which branch ran, but not why. You want to stop before a condition, inspect the record, and step through the code yourself. You do not need a captured online execution to do that locally.
XrmGhost runs your compiled plugin in a separate host process. Start it with -w, attach Visual Studio, and the plugin executes against the context in your scenario file. No Plugin Profiler capture or deployment is part of this loop.
The distinction matters: this is not a replay of a Dataverse execution. You supply the message and data. If the scenario leaves something out, the debugger cannot recover it from an environment.
1. Prepare one reproducible case
Section titled “1. Prepare one reproducible case”You need Windows, XrmGhost installed, Visual Studio with .NET Framework debugging support, and a plugin project that builds. Follow Getting Started if the local host is not ready. Open Visual Studio before starting the waiting run, so you can attach promptly.
For a self-contained example, create a folder named VatValidation and save these files directly inside it, preserving their names:
Open the project in Visual Studio. Open PowerShell in that same folder. The plugin accepts a business account when new_vatnumber is present. Its custom new_accounttype choice uses 505480000 for Business; those names and values belong to this example, not to every Dataverse organisation.
This is a Create-only presence check, not tax-number verification. The companion expected-exception how-to explains the rejected case. You can substitute your own assembly and scenario once the attach loop works.
Build with symbols:
dotnet build Contoso.HowTo.csproj -c Debug -p:DebugType=fullThe supplied project targets net462 and names the assembly Contoso.HowTo, so its DLL and PDB are under bin\Debug\net462. Keep the PDB beside the DLL and open the source from this exact build. The host loads the adjacent symbols when available; an old PDB or a different source copy makes a breakpoint much less useful.
2. Set the breakpoint, then start the waiting host
Section titled “2. Set the breakpoint, then start the waiting host”In VatRequiredPlugin.Execute, set a breakpoint on:
var accountType = target.GetAttributeValue<OptionSetValue>("new_accounttype");Set it before attaching. The host proceeds when it detects a debugger; attaching does not create an extra pause for you to choose a breakpoint afterwards.
Now run:
xg run -a bin\Debug\net462\Contoso.HowTo.dll -t Contoso.HowTo.VatRequiredPlugin -s vat-present.json --data-source mock -w; $LASTEXITCODE-a selects the assembly, -t selects the fully qualified plugin type, and -s supplies the scenario. --data-source mock keeps service reads on scenario data. -w is short for --debug-plugin-wait; it is not the diagnostic-output flag --debug.
The CLI prints the host’s process identifier and attach instructions. Use that identifier rather than choosing an arbitrary process with the same name.
Captured on Windows with CLI 1.7.7 and Core 1.1.0:
XrmGhostCLI v1.7.7  |  Core v1.1.0
Executing Plugin: Contoso.HowTo.VatRequiredPluginAssembly Path: bin\Debug\net462\Contoso.HowTo.dllScenario Loaded: Business account with VAT must be accepted---------------------------------------------------------------------DEBUG MODE: FrameworkHost (PID: 5464) started and is waiting for debugger.1. Attach your debugger to XrmGhost.Framework.Host.exe process.2. Set breakpoints in your plugin code.3. Resume execution in the debugger (e.g., press F5).---------------------------------------------------------------------
- Waiting for FrameworkHost (PID: 5464) to become healthy. Timeout in 60s...
3. Attach Visual Studio to the host
Section titled “3. Attach Visual Studio to the host”Choose Debug → Attach to Process. Find XrmGhost.Framework.Host.exe with the identifier printed by this run. Attach using the managed .NET Framework debugger, not the .NET/Core debugger and not the CLI’s xg.exe process. Exact dialog labels can differ between Visual Studio versions.
Attach promptly: the CLI’s host-health polling has a finite budget of 120 attempts at 500 ms intervals. The host waits before starting its server. If that startup budget expires while you are arranging windows, start a fresh run and use its new identifier.
The attach capture is from a subsequent run, whose terminal printed PID 17332:
XrmGhostCLI v1.7.7  |  Core v1.1.0
Executing Plugin: Contoso.HowTo.VatRequiredPluginAssembly Path: bin\Debug\net462\Contoso.HowTo.dllScenario Loaded: Business account with VAT must be accepted---------------------------------------------------------------------DEBUG MODE: FrameworkHost (PID: 17332) started and is waiting for debugger.1. Attach your debugger to XrmGhost.Framework.Host.exe process.2. Set breakpoints in your plugin code.3. Resume execution in the debugger (e.g., press F5).---------------------------------------------------------------------
| Executing plugin in FrameworkHost...
The dialog shows XrmGhost.Framework.Host.exe (17332) and code type Automatic: Managed (.NET Framework 4.x) code.
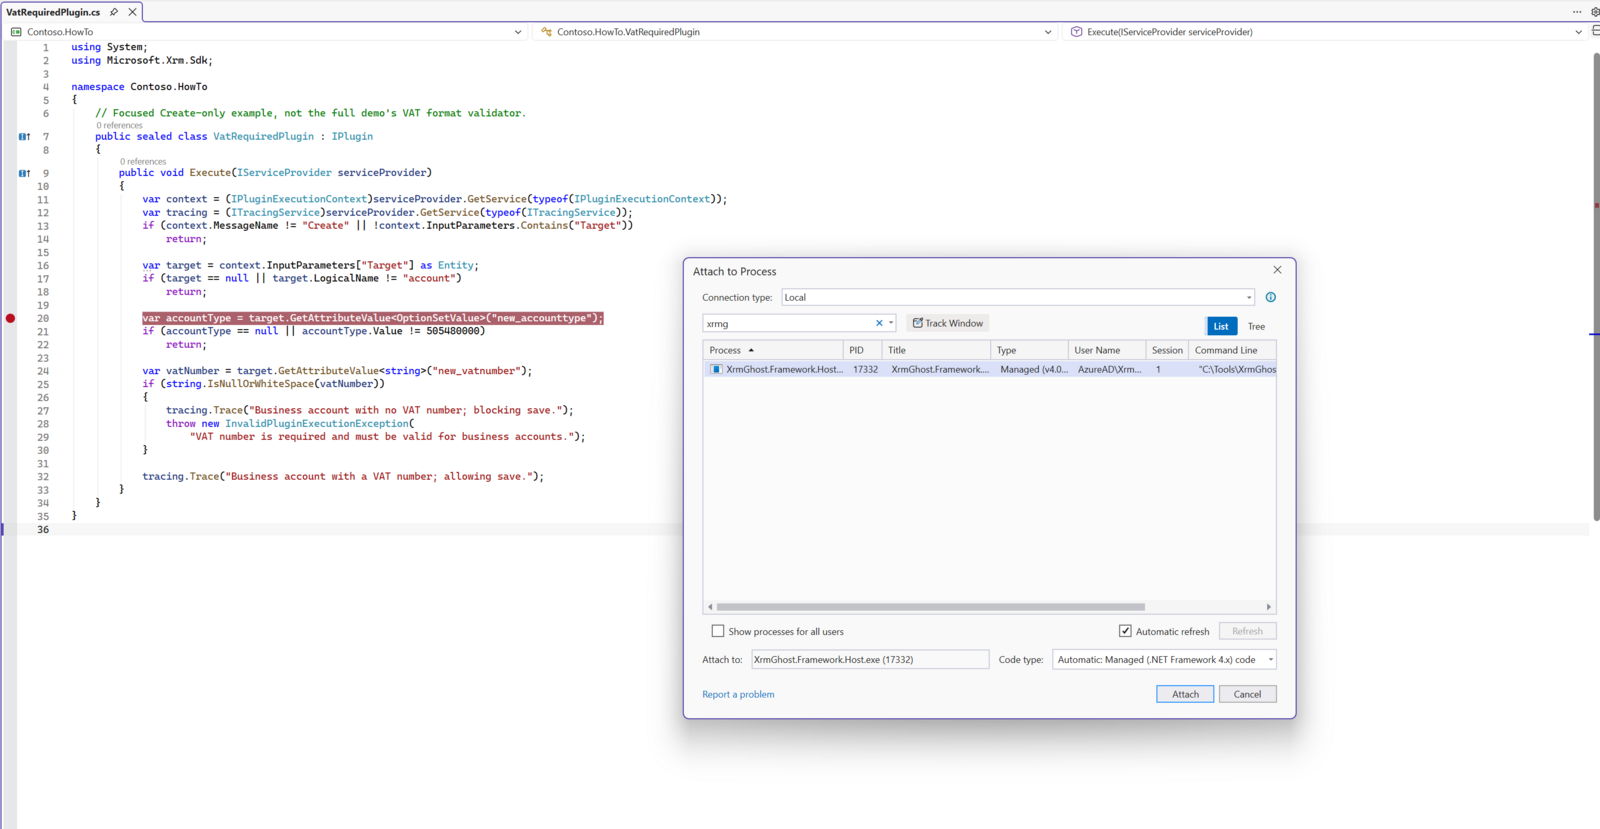
Once attached, execution should reach the breakpoint. A breakpoint can remain pending until the assembly loads. If it stays unbound, check that the selected DLL, adjacent PDB and open source match. Rebuild and start another run after correcting them.
4. Inspect the scenario, then continue
Section titled “4. Inspect the scenario, then continue”Execution stopped at the account-type read on line 20. Step over that read, then hover over accountType.Value: the captured data tip shows 505480000.
Step over the VAT read on line 24, then hover over vatNumber. The capture below shows both data tips: accountType.Value = 505480000 and vatNumber = "IT12345678901", with execution paused at line 25. These values match vat-present.json; this is hover inspection, not a Locals-window capture.
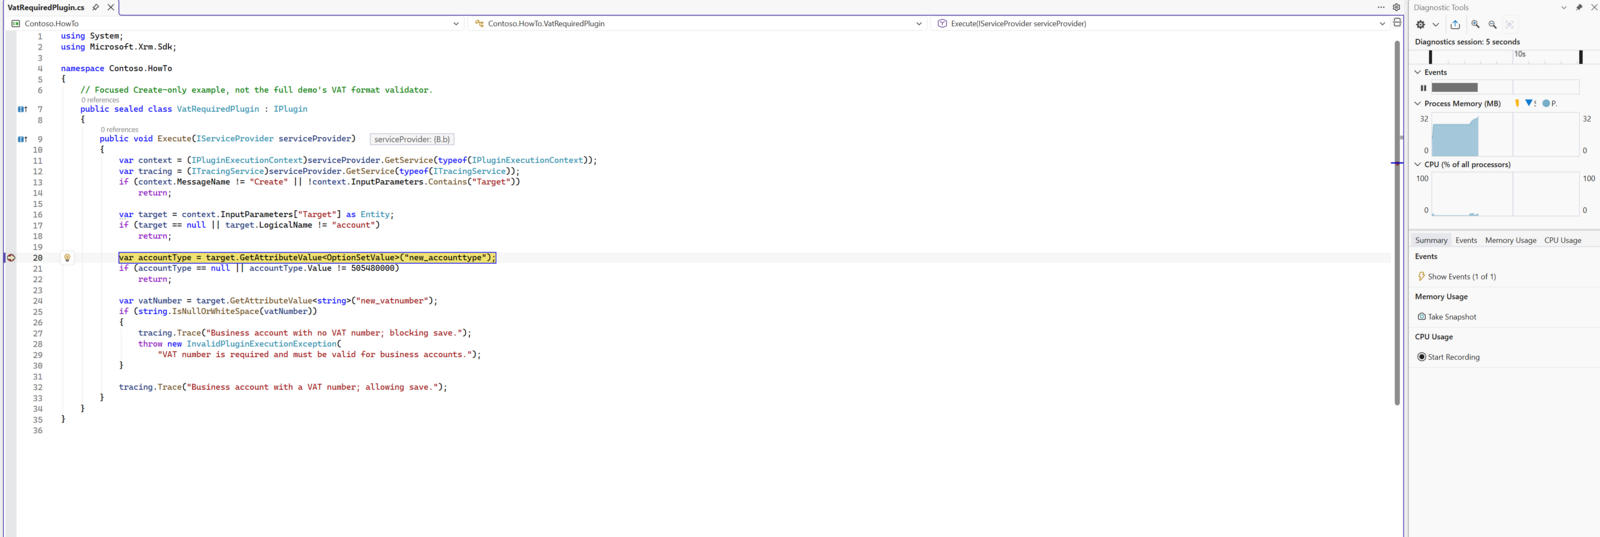
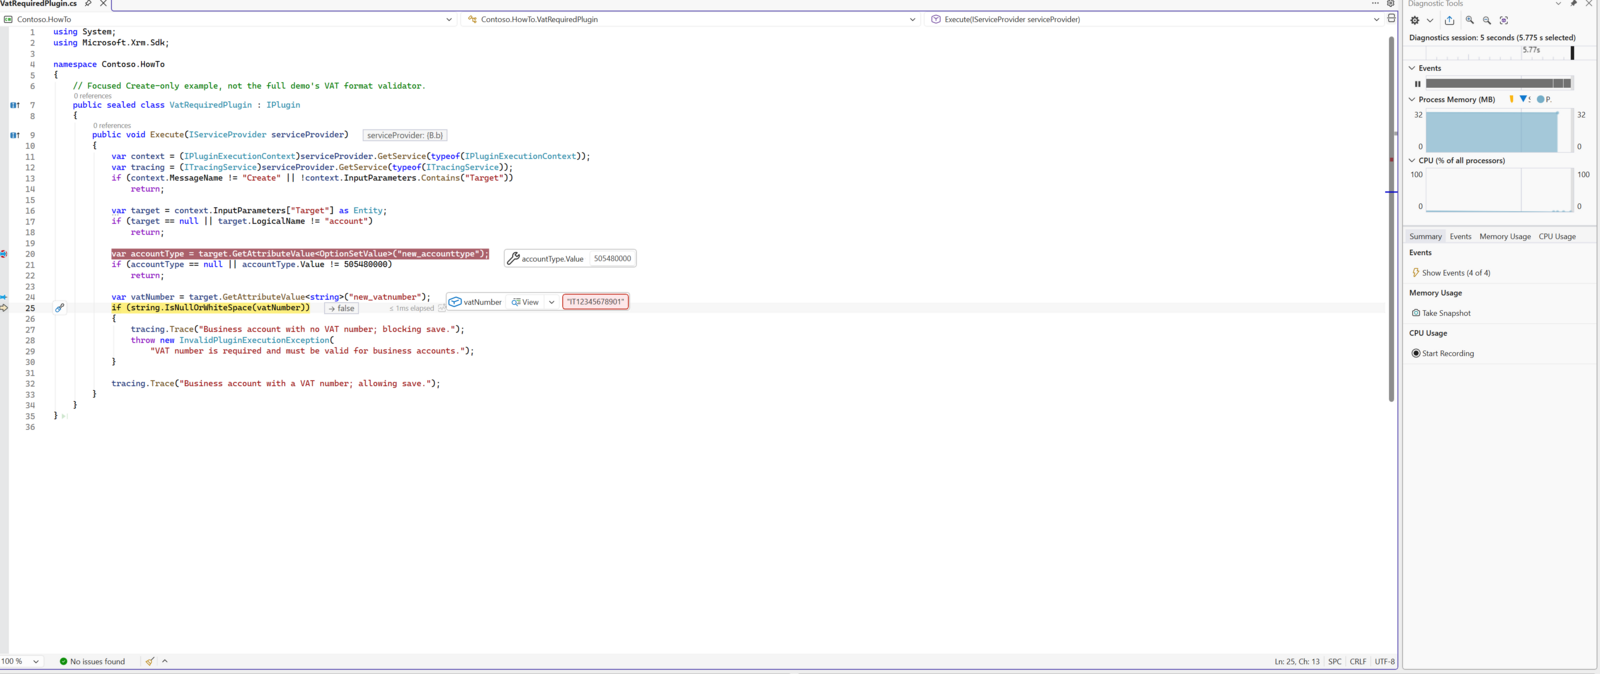
Continue with F5 when you are done inspecting. The terminal receives the plugin trace and outcome. After the run, the CLI terminates its host; another run means another process and another attach.
A subsequent debugger run, captured on 2026-10-29 with CLI 1.7.7 and Core 1.1.0, printed the following. The final 0 is the exit code printed by $LASTEXITCODE after continuing execution.
DEBUG MODE: FrameworkHost (PID: 11952) started and is waiting for debugger.1. Attach your debugger to XrmGhost.Framework.Host.exe process.2. Set breakpoints in your plugin code.3. Resume execution in the debugger (e.g., press F5).------------------------------------------------------------------------ Plugin Execution Result ---Entity Operations Summary:Total Operations: 0Successful: 0
Trace Log:   PLUGIN             | 146ms    | Business account with a VAT number; allowing save.
Performance:[PERFORMANCE] Total: 146ms, Traces: 41 [Framework: 25, OperationTracker: 9, AssemblyResolver: 4, Plugin: 1, Diagnostic: 2]
Final Entity States: [PRO FEATURE - UPGRADE TO UNLOCK]   View final entity data, plugin modifications, and newly created records.   Get detailed insights into what your plugins actually changed.   $ Upgrade to Pro: https://www.xrmghost.tech/#pricing
Execution Succeeded!Output Parameters: {}0PS C:\src\contoso-demo\howto\vat-validation>
What to keep after debugging
Section titled “What to keep after debugging”Keep the scenario alongside the code. Change its data, rebuild when code changes, and repeat the same run to investigate another branch. Add expected-exception assertions when you know the intended outcome, so the next check does not require a debugger.
The host is not the full Dataverse pipeline. A local breakpoint proves what this assembly does with this context; it does not prove registration, security, or interactions in your target environment. Validate those there. The xg run reference covers the command; this page covers the human part of the loop.